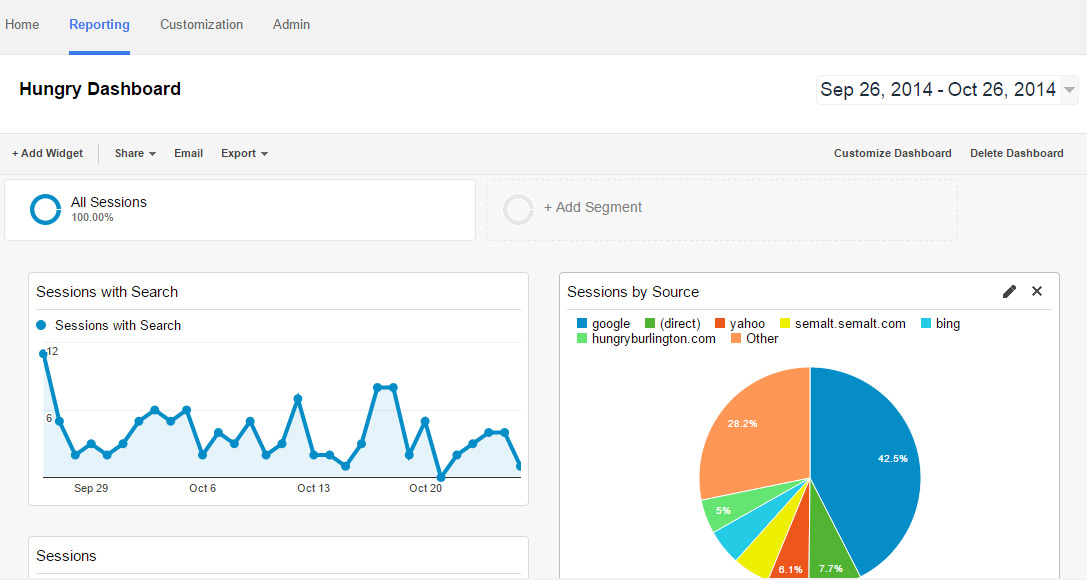
With the holiday gift giving season just around the corner, it’s time to start thinking about tracking holiday promotions. Google Analytics offers Dashboards, which are a great way to keep track of individual projects —— and they’re easy to set up and share.
Easy Dashboard Set Up
Almost any table, chart or graph you can navigate your way to in Google Analytics, can be added to a Dashboard by using the cleverly named “Add to Dashboard” link near the top under the report name. One example would be if you’re getting referrals from a website and you want to see what devices people are using to view your site: navigate to Acquisition / All Referrals then click on the referral link you want to isolate. In the next screen choose a Secondary Dimension (just below the line chart) to break the info down. In this case you would choose “Device Category” to see how many people coming from your selected source are viewing your site on desktops, tablets and mobile devices. Because you, or someone you know is obsessed with this or finds this information fascinating, having it emailed daily, weekly, monthly or quarterly keeps you or your recipient rolling in data automatically.
Beyond the Holidays
Dashboards can be set up for more broad views of your website traffic for regular reporting. Having a regular snapshot of your website will give you a glimpse into overall trends. You can keep an eye on which content is doing well, and what needs to be replaced. Seeing any sudden spikes or dips in traffic in your weekly report? Don’t wait until the end of the month to address it. Did a recent event covered in the news spark an interest in your website? Check your weekly or monthly reports for a spike and its source.
Give the Gift of Google Dashboards
If you’re looking to save time and money, give someone (or yourself) the free gift of a Google Analytics Dashboard this season. And make it the gift that keeps on giving by having it emailed on a regular basis.


